Smart Vending Business Intelligence: Metrics That Actually Move Profit
Smart vending business intelligence is the use of connected machine data to make better decisions about assortment, service timing, pricing, and route performance. The phrase sounds sophisticated, but the real test is simple: did the dashboard change what the operator does this week, or did it merely generate prettier ways to admire the problem?
That is the standard worth keeping. If a BI layer does not reduce stockouts, cut wasted trips, improve product decisions, or protect margin, it is not especially intelligent. It is just decorative reporting with ambitions.
The data layer starts with connected machines
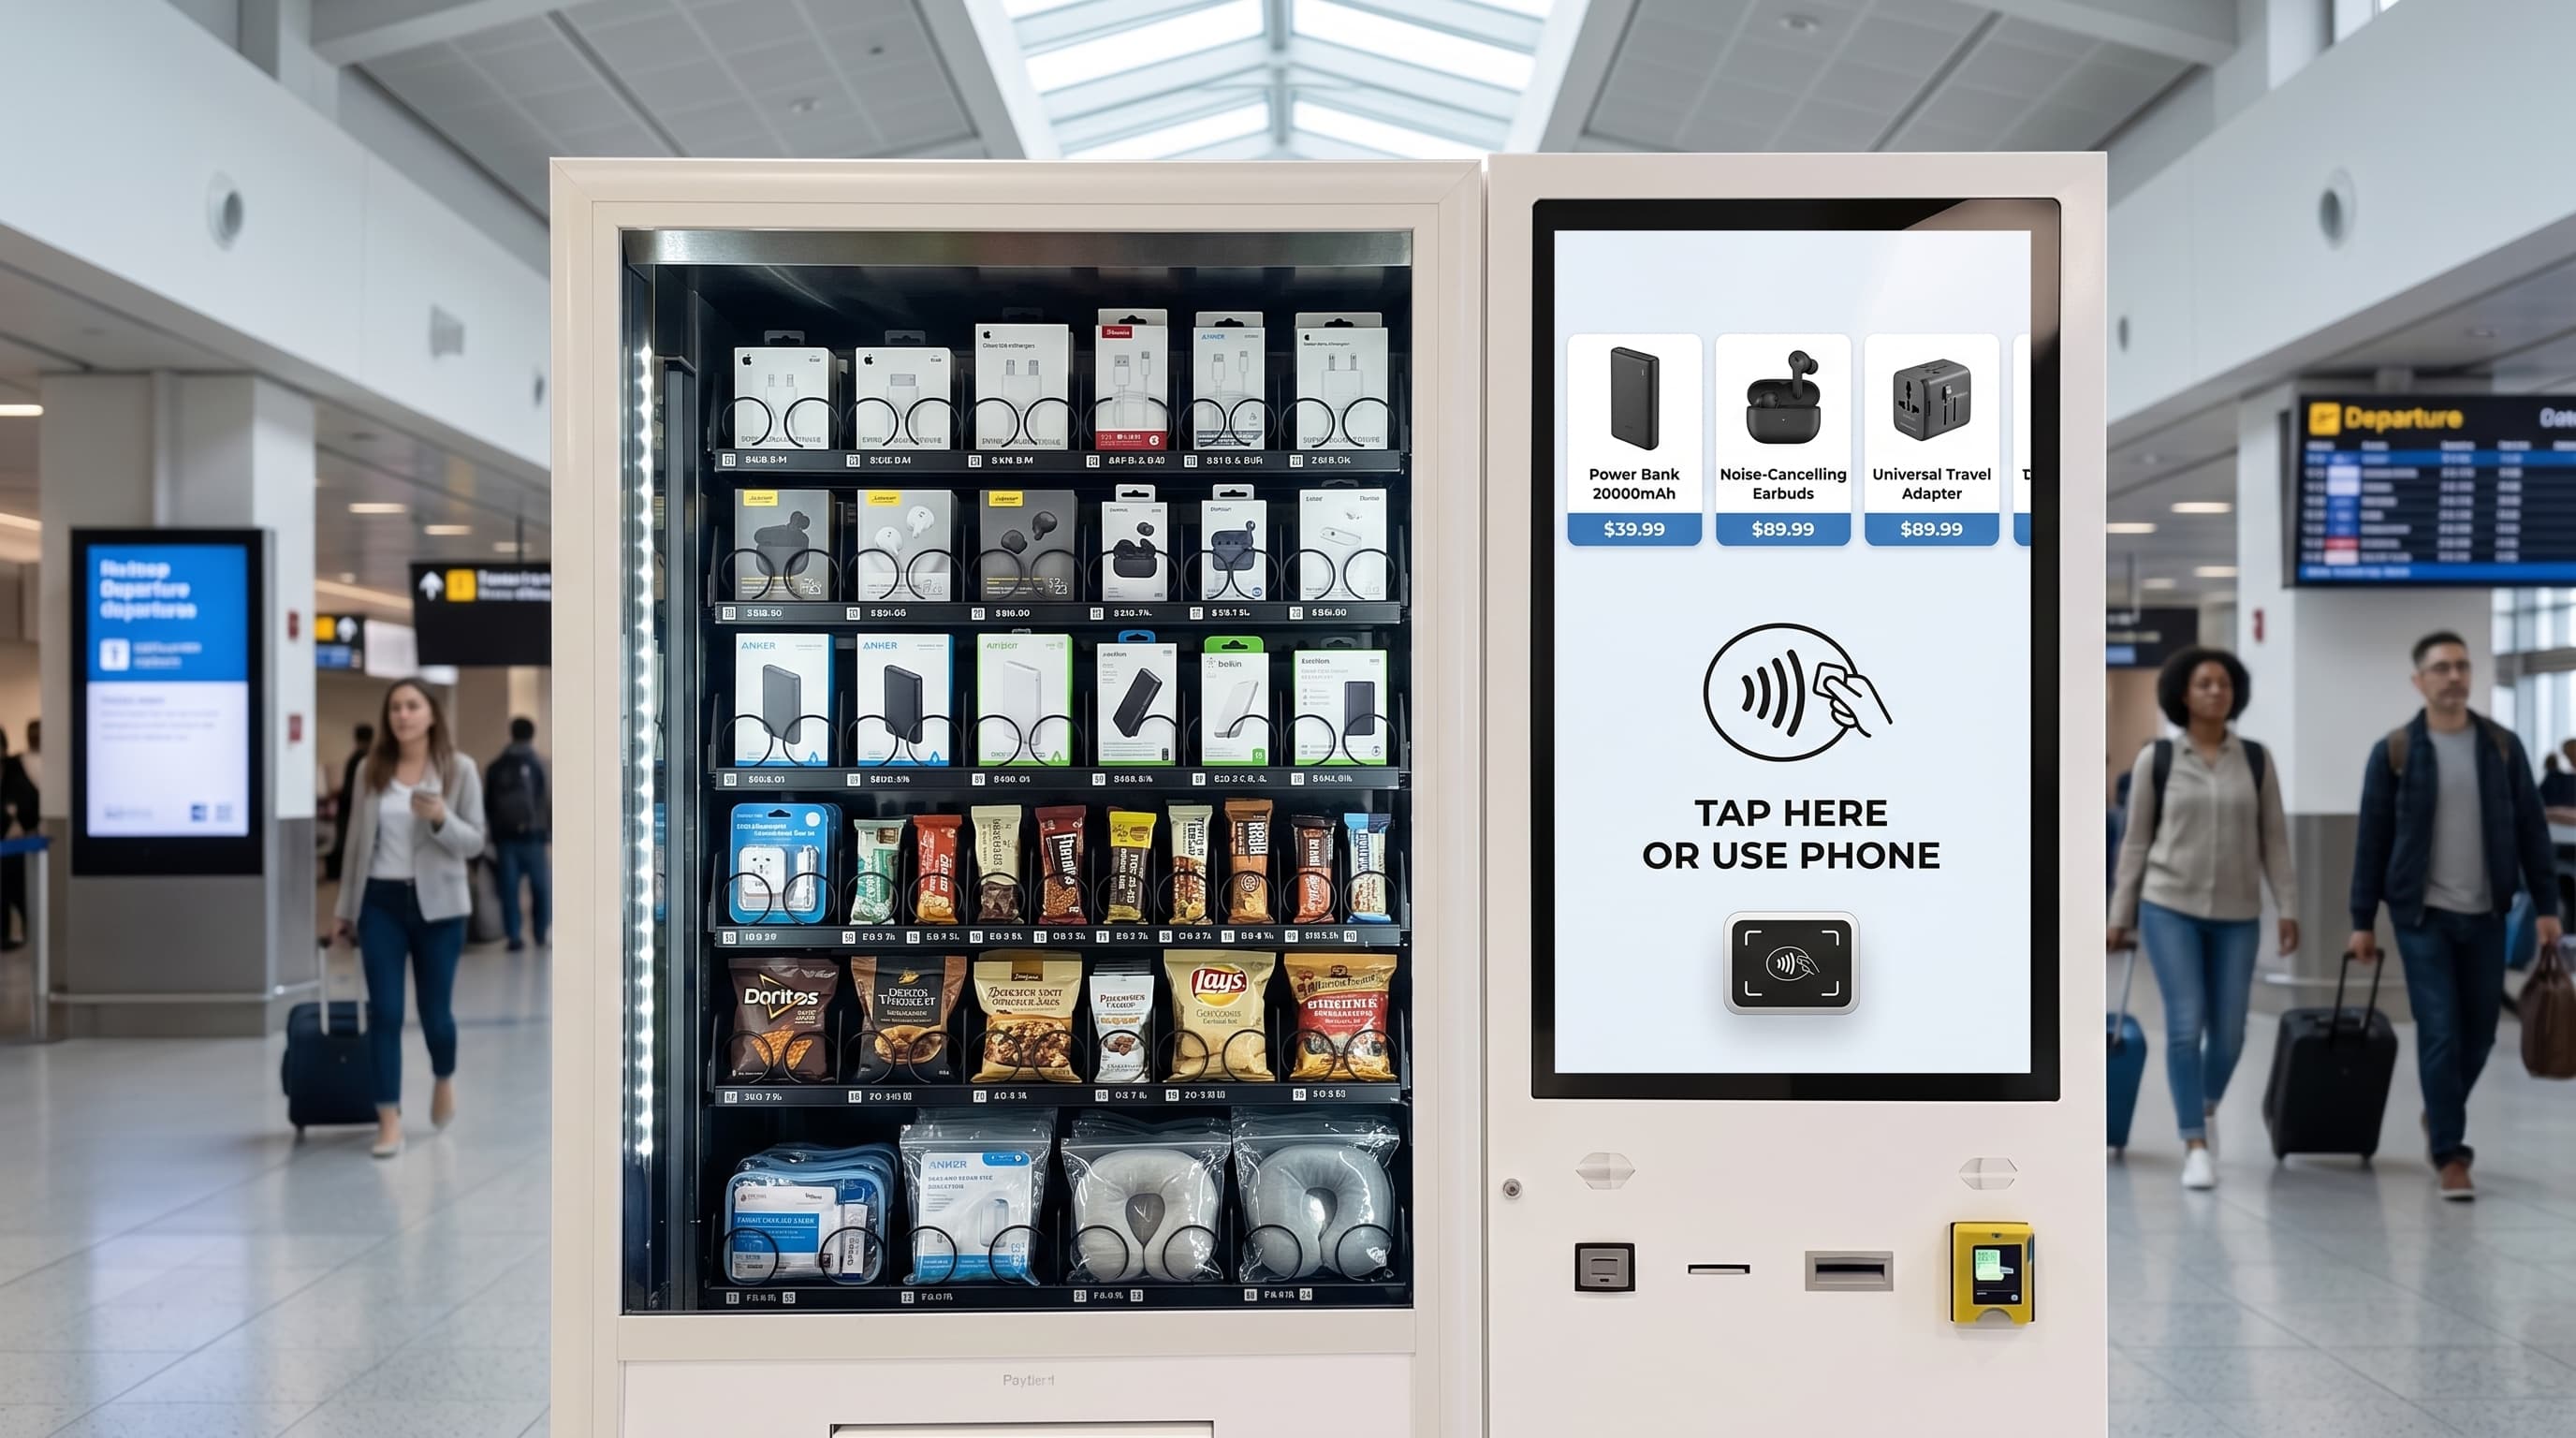
A smart vending route can report sales, stock levels, machine status, payment behaviour, and various alerts remotely. That is what gives operators visibility before they arrive on site. Without that data flow, business intelligence usually collapses into spreadsheets, memory, and a driver muttering “I thought that one was fine” in a car park somewhere.
Connected reporting matters because it changes the route from calendar-led servicing to need-led servicing. The operator sees what requires attention before the visit instead of discovering it after time and margin have already been wasted.
The metrics that usually matter most
SKU velocity shows what actually sells by location and by machine. Stockout rate shows how often the route is missing revenue because products are running empty between visits. Service-trip cost shows what it really costs to keep a location running. Margin per visit shows whether the machine is producing enough gross profit to justify the service burden.
Those four metrics do more real work than most larger dashboards. Operators can build plenty of additional charts, but unless the number helps change planogram, route cadence, or site priorities, it is probably decoration rather than operating logic.
Good BI is built around route decisions
The right weekly questions are practical. Which machines are stocking out too often? Which sites are being visited more than their sales justify? Which SKUs look healthy on revenue but weak on margin? Which machines are losing sales because payment or connectivity issues keep getting ignored?
That is where business intelligence becomes useful. It gives the operator a short list of problems worth fixing, rather than a longer list of charts worth scrolling past.
Stock visibility matters more than averages
Average route performance can hide the real issues. One machine with repeated stockouts or one site with weak margin can quietly drag performance while the broader dashboard still looks respectable. This is why exception-based review is usually more valuable than broad summary reporting.
Operators should look first at what is abnormal: sudden sales drops, repeated empty facings, strange service frequency, failed payments, unusual spoilage, or recurring machine faults. The average can wait. The outlier is usually where money is escaping.
BI supports growth only when the operating discipline exists
Once a route is stable, the same BI layer helps with expansion. It can show which site types support premium pricing, which planograms travel well across venue types, and where a machine format repeatedly underperforms. That is how data becomes a planning tool rather than a mere report card.
But the growth value only appears when the basics are already in place. A messy route with unreliable service discipline does not become strategic because it bought a dashboard.
Business intelligence should make the route calmer
The best BI systems do not make operators feel busier. They make the route feel calmer because fewer surprises survive to service day. That means fewer unnecessary visits, fewer avoidable stockouts, fewer low-margin habits, and clearer decisions about where attention belongs.
That is what smart vending business intelligence is for. Not theatre. Just better route control with less guesswork.
Need better data discipline across a connected vending route?
DMVI helps operators link machine telemetry, product decisions, and service cadence so the BI layer improves route performance instead of just producing nicer charts.